- AI, DevOps, Tutorial
Data Workers: Face (and Assess) 2026 AI on Your Own Turf Now!
Not by *reading* this article. And certainly not by listening to the noise raining on our newsfeeds by billionaire A trash talking billionaire B over the next big thing. This hands-on tutorial is meant to help you go full throttle and see yourself. To get a true feel of the state of AI w.r.t. to our profession, assess the degree to which you want to use it in your work and possibly experience your Empire-Strikes-Back moment.
- Rust, Quarto, AI
Humans in the Vibe
Hikaru still plays chess, Harry Mack still freestyles, and software stocks still hold value even as single developers reproduce established suites in record time. I built a small macOS time tracker trying to add value as a human in the AI age — and to find out where creating software is still fun. The result is jellytrack: a Tauri + Rust + SQLite menu-bar app with a sibling Quarto reporting layer.
- SELF-HOSTED, DevOps, Tutorial
Tuning Our Lab Setup for Production
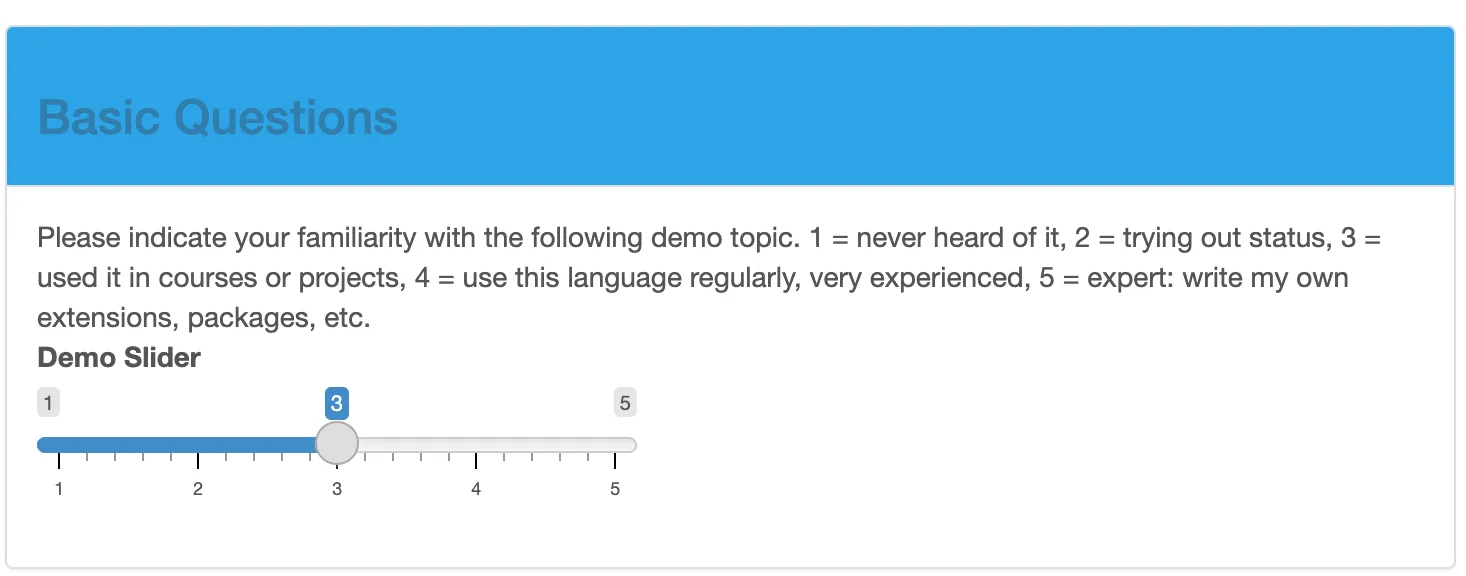
We revisit our Shiny + Postgres survey example from the previous post and show how to keep the exact same functionality while cutting image size in half, and reducing the dependencies. By switching to a lighter Alpine-based R image and making dependencies explicit, we turn a teaching prototype into a leaner, more portable production setup that is also suitable for CI/CD.
- SELF-HOSTED, DevOps, Tutorial
From Lab to Production: an R Shiny Survey with a Database Backend
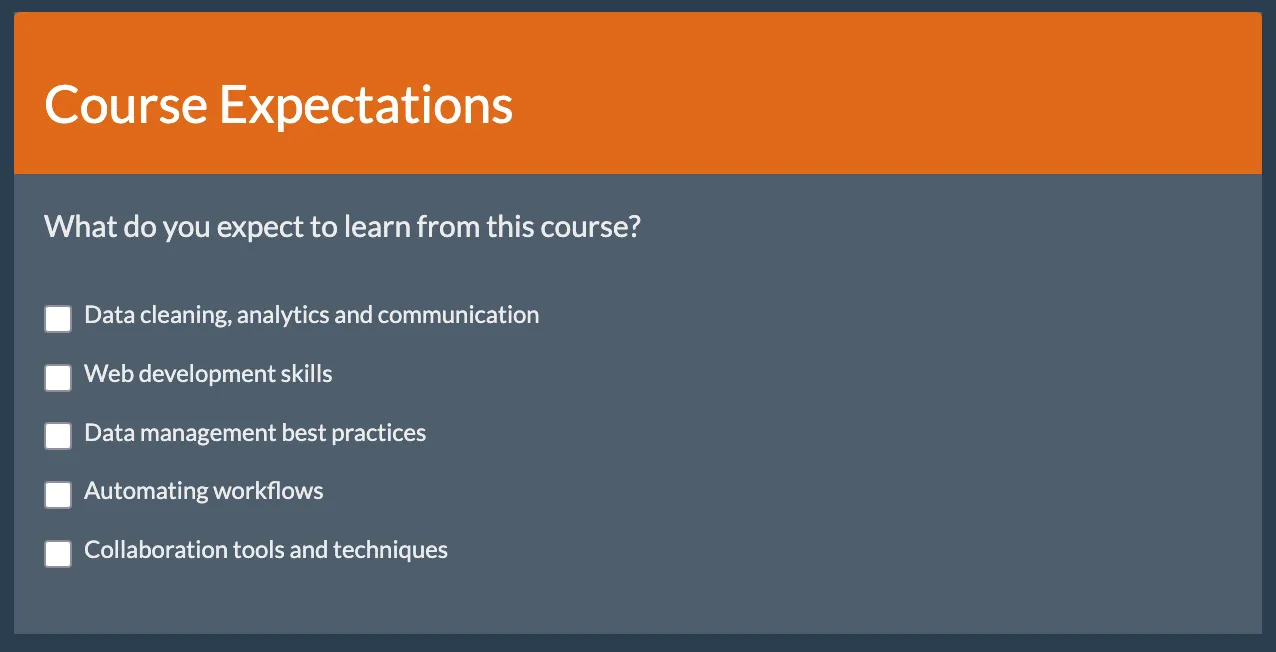
At the first glimpse, building a survey application might seem like a frontend exercise, but it's actually a great vehicle for understanding Docker and containerization. An online survey inherently requires multiple components working together: a web interface for participants, a database for storing responses, and communication between these parts. These needs make it an ideal real-world example for learning docker-compose - a tool to coordinate multiple application parts in light weight fashion.
- Lecture, Tutorial
H4Sci @HSG, Guest Lecture - Leverage APIs for Economic Data
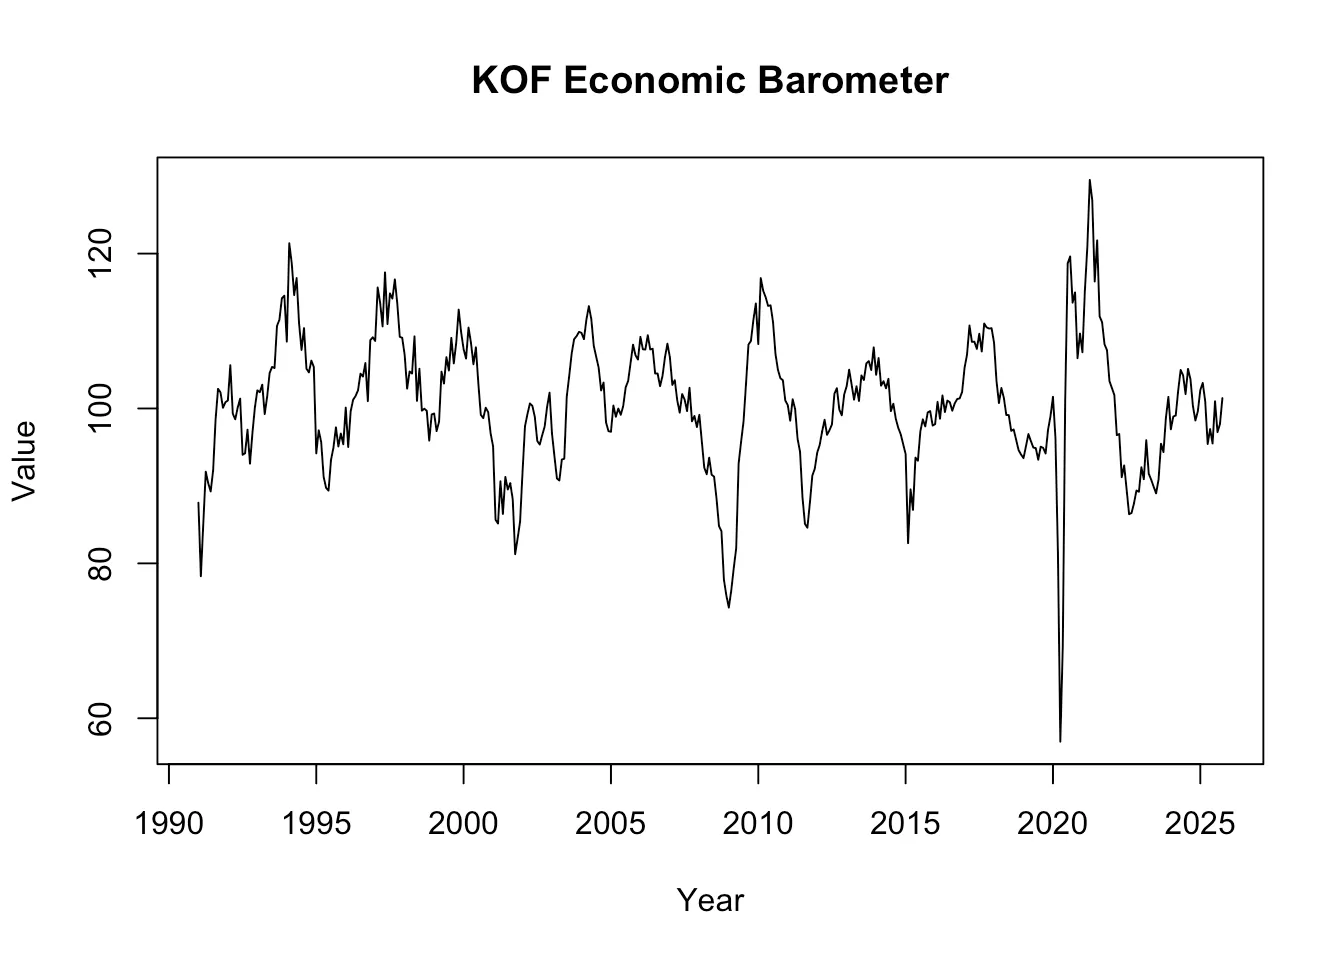
The reason you see an Economic Index even though this post is about APIs and their usage for economic data is that we will explore the data part of what it takes to create our own economic index, i.e., what it takes to efficiently gather more than 300 time series.
- Recap
H4Sci 2025: Block 1 - Course Debriefing
Stack -- a developer's toolkit. We discussed how much DevOps a researcher and analyst really needs. Not all rabbit holes are for everyone. Git version control carpentry may be the one skill you must take a way from a semester of hacking for science... Read more!

